Wednesday, December 18, 2013

November Discussion


November Climate Recap:


Some of the notable summary are:

  • The average temperature over global land and ocean surface for November 2013 broke the record of 134-year period of record at 0.78 above the 20th century average of 12.9C
  • Land surface temperature was 1.43 C above 20th century average of 5.9C, the second highest November on record, behind 2013. 
  • Ocean temperature was 0.54 C above 20th century average tying with 2009 and 2012 as 4th warmest September to November on record.


Overall November pattern, which I have kept in tap throughout the month for 500mb is as below:


NAO (North Atlantic Oscillation) Index:


NAO switched to quick positive forced Greenland surface arctic air to pool over NW Greenland quite healthily. With this feature, I noticed the arctic vortex was spinning over Kara Sea started to become unstable at times and tend to reform over Canadian arctic due to "Thermal Kelvin Wave" was sending into upper atmosphere which was induced by stronger baroclinicity over Northern part of Green Land into Hudson Bay compare with rest of the arctic area (Lower than normal arctic air vs open sea). This Thermal Kelvin Wave draws the upper low (main arctic vortex), traveled along with the Rossby Wave and the main jetstream slowly into Canadian Arctic region due to lower pressure tendency as well. The feature is slow to progress, but the trending is very clear. Which ultimately making the Siberian Vortex much weaker from Mid November to now. 

Added the Land and Ocean temperature percentiles for November under.


Just in my humble opinion...


Source:
http://www.ncdc.noaa.gov/sotc/global/

Tuesday, October 29, 2013

霜降 貳 (Shuangjiang Follow up for Toronto)

Shuangjiang (Frost Descent):


As for the post earlier explained, Shuangjiang for 2013 is starting from October 23rd and end around November 7th. It is the first appearance of frost after summer solstice of a year in climatic average in relation of ecliptic longitude of the Sun.

This the minimum temperature for CYYZ for 2013 in October.

Day in October,2013 Minimum Temperature
1 10.8
2 11.9
3 7.7
4 15.1
5 13
6 14
7 7
8 6.4
9 6.5
10 7.3
11 6.3
12 6.2
13 8.7
14 6.7
15 5.9
16 10.3
17 9.6
18 7.6
19 3
20 2.7
21 6.8
22 3.1
23 0.7
24 0.9
25 1.6
26 2.4
27 1.7
As you can see on October 24th, 2013 reached the minimum temperature 0.9C.  It's the lowest temperature recorded after summer solstice. It is pretty close, but not frosty enough.

This is the observation on November 24th, 2013 at YYZ:

CYYZ 241200Z 25011KT 15SM FEW020 FEW100 BKN120 02/M00 A2981 RMK SC1AC2AC5 SC TR SLP098
CYYZ 241100Z 25009KT 15SM FEW015 FEW060 01/M01 A2980 RMK SC1SC1 SC TR SLP097
CYYZ 241000Z 27009KT 15SM FEW050 01/M01 A2980 RMK SC1 SC TR SLP096
CYYZ 240900Z 29005KT 15SM SKC 01/M01 A2979 RMK SLP093
CYYZ 240800Z 25007KT 15SM FEW070 01/M01 A2978 RMK AC1 AC TR SLP088
CYYZ 240700Z 25008KT 15SM FEW070 01/M01 A2979 RMK AC1 SLP094
CYYZ 240600Z 25009KT 15SM FEW060 FEW070 02/M00 A2979 RMK SC1AC1 SC TR SLP093
CYYZ 240500Z 26008KT 15SM FEW060 SCT070 01/M01 A2979 RMK SC2AC1 SLP094
CYYZ 240400Z 26010KT 15SM FEW063 FEW075 02/M01 A2981 RMK SC1AC1 SC TR SLP098


Now where is frost?
Could this related to some global warming overall so that the lowest temperature after summer solstice might not be "frosty" enough? Many questions could be raised here, but the lowest temperature got closest to 0 C after summer solstice definitely makes some remark when Ecliptic longitude reaches around 210 degrees to 225 degrees.

Let's look at Oct 28th, 2013 into Oct 29th, 2013 night, 5 days after the day of "Shuangjiang" (210 degree)

CYYZ 291300Z 36005KT 15SM FEW060 FEW240 M01/M05 A3048 RMK SC1CI1 SC TR SLP329
CYYZ 291200Z 36005KT 15SM FEW065 FEW240 M03/M06 A3046 RMK SC1CI1 CI TR SLP323
CYYZ 291100Z 36005KT 15SM SKC M02/M05 A3045 RMK SLP318
CYYZ 291000Z 01005KT 15SM SKC M03/M06 A3045 RMK SLP318
CYYZ 290900Z 36006KT 15SM FEW065 M02/M06 A3044 RMK SC2 SLP314
CYYZ 290800Z 36005KT 15SM FEW070 M02/M06 A3043 RMK AC1 SLP312
CYYZ 290700Z 36004KT 15SM FEW070 M01/M05 A3043 RMK AC1 SLP311
CYYZ 290600Z 01006KT 15SM SCT070 M02/M05 A3043 RMK AC3 SLP312
CYYZ 290500Z 36006KT 15SM SKC M01/M05 A3042 RMK SLP308
CYYZ 290400Z 36007KT 15SM SKC M00/M05 A3041 RMK SLP305
CYYZ 290300Z 36009KT 15SM SKC 00/M05 A3041 RMK SLP304

Temperature definitely drop below 0, but relative humidity is marginal for significant frost (RH >= 80%), but it was good enough rather.

All in all, for ecliptic longitude reaches around 210 to 225 degrees, AKA Shuangjiang (Frost Descent), at least this year, we have seen the timing of the lowest temperature that dipped close or below zero fall into this period of time for Toronto area.


Friday, October 25, 2013

藤原の効果 (Fujiwhara Effect)

Rotation of Binary Cyclone - Fujiwara Effect


It is explained for the motion of the two vortices in close proximity. When two vortices moved close to each other, they are going to rotate "counterclockwise" to each other.
http://en.wikipedia.org/wiki/File:Fujiwhara_Diagram.jpg


Basically two vorticies are driven by each other's flow on the other side of the area of effected wind flow.


(taiwanpedia.culture.tw/images/media/earth/G012.jpg)
Figure above clearly showed how the canceling wave and wind vector to each vortex affect the overall movement speed of the two vortices as well.

In May 1st, 1995.  B. Ziv and P Alpert from Department of Geophysics and Planetary Science in Tel Aviv University in Israel explained how Fujiwara Effect is still in action in mid latitude as well.
(http://journals.ametsoc.org/doi/abs/10.1175/1520-0469%281995%29052%3C1357%3AROBCDA%3E2.0.CO%3B2)

This effect is widely observable on two Tropical Storms are in close proximity of each other.
The clip below will show clearly of this effect on Tropical Storms.
As for mid latitude storms, sometimes when two rotating vortices will re-energize and affect the stability on the jet stream, and form another weather system because of this effect.
The video below showed how Fujiwara Effect on 2 sets of mid latitude storms are interacting to each other.
(http://commons.wikimedia.org/w/index.php?title=File%3ASevere_Tornado_Outbreak_in_the_Southern_United_States.ogv)
A wave of low pressure system went through Southern Ontario first, the upper low is ejected into Lake Superior. The new cyclonegenisis is forming at 0:05 of the video. The new cyclongenisis intensified the weak low over Kansas and Oklahoma.  While the new low travel along the jetstream and the upper feature start to take shape at 0:11 near Michigan and start to do the Fujiwara Effect with the low earlier over Lake Superior.  The Superior vortice quickly moved around the new Michigan vortice.  As the Superior moving South to Southeast direction, it has come in closer proximity of the low earlier drifting over Kansas and Oklahoma then pushed that low faster than it is supposed to be eastward towards the jet stream due to Fujiwara Effect and formed the next cyclongenisis a bit stronger as well.  Then the Oklahoma Low started to dance with the Lake Superior low near the end of the video with more Fujiwara hint in it.

For mid latitude storms in average, the vicinity of 2000km of each other (really depended on each other's wind field and strength) will start to feel the effect.  To have more significant acceleration, they must get closer to 1000km to each other.  But to pinpoint the movement of multiple vortices in mid latitude is depended on the size of the two vortices, the distance to each other and the prevailing atmospheric wind direction at that period of time. The effect is also more predominant when the vortices is in the same side of the jet stream.

Today over West Coast, we have noticed the slow down of the vortices over Southern BC. As you see the 500mb wind field around the southern vortice over Eastern Pacific and BC vortices (maybe a little bit Nevada vortice, but it is further away) started to interacting to each other.
(From NECP NOAA)


The circled red area showed the change of wind field between two vortices, which means there are some pull on each other.

From satellite loop (too big to post, might need to shrink the loops later) shows that 3 major vortices in place. One over Nevada, one over Eastern Pacific and the other one over Southern BC. New wave of low from Yukon to Prairies has pushed the BC vortice a little south and getting closer proximity toward the upper low over Eastern Pacific. This low has been forecasted by all the models from the past few days in slower eastward and even a tad westward trend. GEM is having trouble to pinpoint the exact location of the low is going to be.
BC low progression from 36 hr GEM run into 0hr initialization at 500mb of the same day.

 Due to this upper low lingered in speed has slowed, the wind field near the surface and longer duration of the subsidence from south west quadrant of the low centre made fog dissipation for Strait of Juan da Fuca a little faster on visible satellite.

This is a very subtle Fujiwara Effect, but definitely played a role with our weather systems :)


Thursday, October 24, 2013

霜降 Frost Descent


霜降(Frost Descent):


( Weather Gibberish Talk by Gary Lee)


Shuangjiang (霜降)literal meaning is “frost descent”, is one of the 24 jieqi (Solar Terms) in ancient Chinese culture. Shuangjiang means the Sun reaches the celestial longitude of 210 degree and ends when it reaches when longitude of 225 degrees. In Georgian Calendar, it usually starts around October 23rd and ends around November 7th each year.

What is Celestial longitude? It is part of the Celestial coordinate system that people used to track the positions and orbit of the Sun in ancient time. The most widely used in here would be astrology’s celestial sign for each month. In Chinese, it is called HuangDao, literal meaning is “Yellow path”. Since Sun is yellow, it is also called Solar Path. In English, we just call it Ecliptic.

Diagram below is in courtesy of http://zh.wikipedia.org/wiki/File:AxialTiltObliquity-zh-Hans.png
with direct translation by my crude skill.

Figure above is from http://en.wikipedia.org/wiki/File:Ecliptic_grid_globe.png. It shows the relationship of celestial coordinate with longitude and latitude.


Now the animated diagram below shows the correlation of the season with Celestial Longitude.

with courtesy of http://en.wikipedia.org/wiki/File:Ecliptic_vs_equator_small.gif

Because the starting of the Chinese Culture is around 30 degrees to 50 degrees latitude, 24 jieqi (Solar Terms) are suitable for mid-latitude of Northern Hemisphere. Due to the Sun is slowly moving away from Equator in latitude, 24 jieqi recorded down the most probable botanical, biological and weather phenomena in average throughout the year.


Around the period of Shuangjiang, the air temperature around this latitude will get to 0 degree at night and cause morning dew to freeze into frost.


Since 24 jieqi is the climate average phenomena of latitude 30 to 50, then we should look at the climate average of this latitude first.

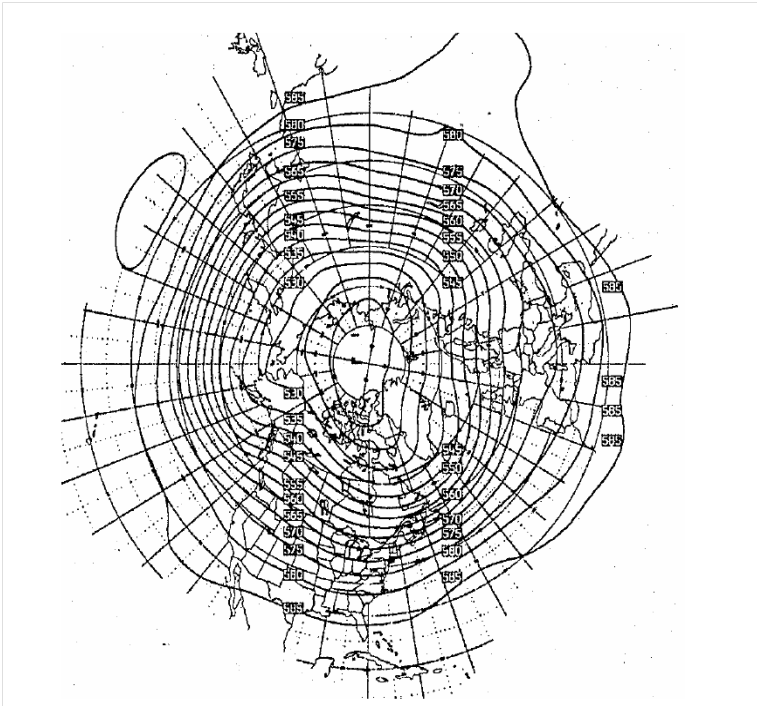
Figure above is the 500mb average height contour of October 1949 - 1978. 560 dam to 570 dam riding right across Southern Ontario with 555 dam to 565 dam going across Southern BC into Prairies. With the hint of the Arctic vortex near the polar region, Eastern Pacific ridge, Bering trough, Western Pacific ridge, Eastern Asian trough, and Caspian ridge.


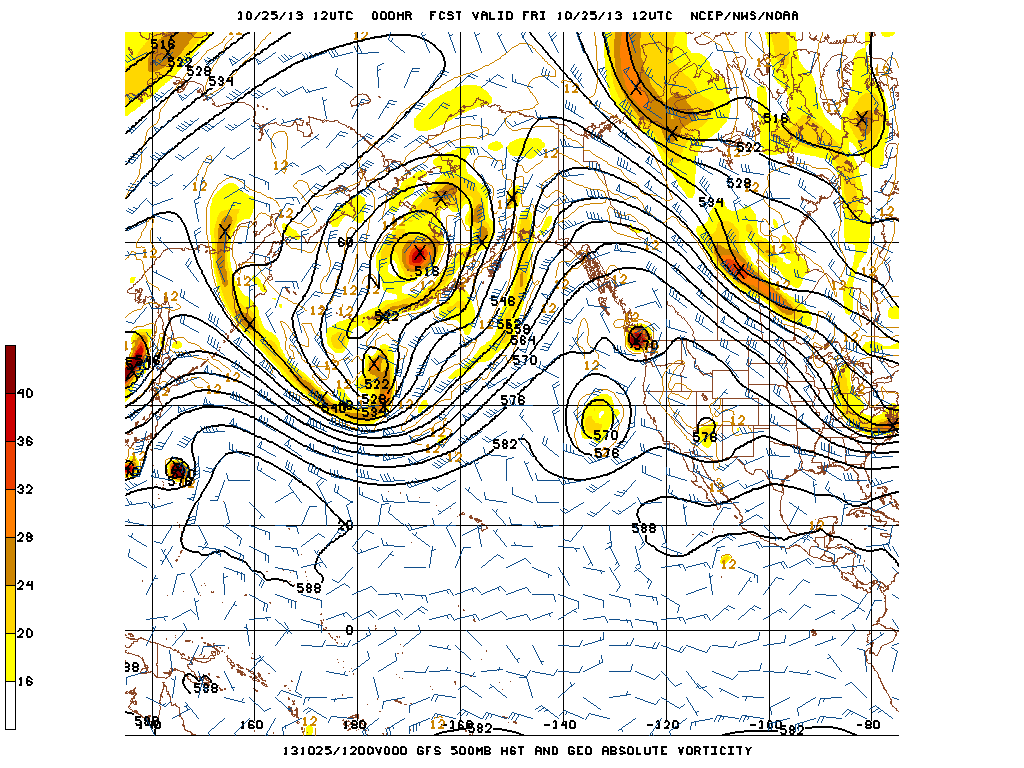
Now let’s compare the above with this year’s 500mb Height Contour below.

The magical 560 dam to 570 dam area riding around Southern Ontario, which is conforming with the climate average. With a slightly stronger than normal Eastern Pacific Ridge across BC, a deeper Bering Sea trough, and deeper Icelandic trough are the only anomalies. Otherwise, the position of the arctic vortex and climatological trough and ridge position are in decent consensus.


Let’s look at the “near surface” average.

Figure above is the Monthly mean 1000mb contour for October 1949-1978.

Broad area of Northern Atlantic High, East and West Pacific Ridge, Bering Low, Mongolian/Capsian High, and Icelandic Low is the climate average of the surface prominent feature of Northern Hemisphere.


Now let’s look at this year.

The striking similarity to climate average with the good positioning of the arctic vortex, slightly stronger Icelandic low and Bering Low, decent Northern Atlantic and Northern Pacific High, and relatively good positioning of Mongolian to Capsian High. All in all, this autumn is a relatively normal for most part of North America and other parts of the world.


Now, we have this year is relatively average in climatological speaking established. Since Shuangjiang is related to cold air from Mongolia, and the telecommunication and timing among Hudson Bay trough, East Asian trough, Bering Sea trough, and positioning of the arctic vortex are in great consensus this year. With similar latitude and the 500mb thickness in climate average is very very similar in the place where Chinese developed 24 jieqi and North America in our part of the latitude (from 500mb thickness analysis of climate average picture above), are we likely to see frost in the morning in the period of “Shuangjiang (Frost Descent)” between October 23rd to November 7th of this year in Southern Ontario? The Answer is YES, we are likely to see frost in that period.

http://www.theweathernetwork.com/14-day-weather-trend/canada/ontario/mississauga.

With the forecast shows, ever since 23rd of October, temperature at night will dip close to 0 degree and rural areas of Southern Ontario are likely to see frost in the morning when sky is relatively clear with light wind. Time to get ready to protect your plants with proper attires. :)


Gary Lee


October 22nd, 2013 12:05pm